


SaaS Metrics 101
In the dynamic landscape of SaaS business models, assessing performance and growth requires a deeper understanding of key metrics beyond traditional revenue measurements.

Introduction
In the dynamic landscape of SaaS business models, assessing performance and growth requires a deeper understanding of key metrics beyond traditional revenue measurements. While revenue is important, it can be a backward-looking indicator, reflecting business that has already been booked. This post delves into the significance of leading indicators like Annual Recurring Revenue (ARR), Billings, Bookings and Remaining Performance Obligation (RPO), which shed light on the health and potential of SaaS companies.
Billings
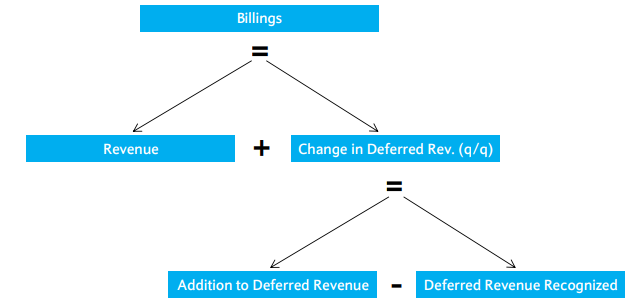
Billings represent the amount of revenue generated from new business during a given period. It provides a snapshot of the company's ability to attract and onboard new customers, ultimately driving expansion. In the world of SaaS metrics, calculated billings has long been regarded as a leading indicator, serving as a reliable measure of new business generated. Higher Billings indicate a healthy inflow of new customers, a strong sales pipeline, and the potential for continued growth.
Before the era of ASC 606, calculated billings, which encompassed revenue and the change in deferred revenue, held a dominant position as a forward-looking indicator. It provided valuable insights into new business generated within a quarter, offering a glimpse of revenue growth trends. With its foundation in GAAP metrics, billings avoided complexities and subjectivity, making it a straightforward and reliable metric. Additionally, billings offered flexibility, allowing for variations such as examining changes in deferred revenue from the cash flow statement or focusing solely on subscription revenue for a clearer understanding of performance.
There are several challenges associated with billings. One significant limitation is its sensitivity to duration. Another challenge arises from the potential for unnatural behavior driven by the pursuit of billings targets. Companies may resort to discounting to secure deals early or extend the duration of agreements to meet billings expectations. Such practices can distort the true health of a business. Moreover, billings can be a volatile metric due to seasonality and fluctuations in billing patterns. Changes in seasonality introduce additional noise, while early renewals or adjustments to co-terminus billing cycles can significantly impact billings figures.
Bookings
Bookings is a leading indicator metric that reflects the total contracted value of present and future business agreements between a SaaS company and its customers. It provides a comprehensive view of the revenue potential beyond current recognized revenue. Unlike revenue or billings, Bookings is not bound by revenue recognition policies or invoicing timings, making it a valuable metric for understanding the total contract value.
Bookings offers a more forward-looking perspective compared to revenue or billings. By considering the total contract value, Bookings provides insights into the agreed-upon business that will contribute to future revenue. This helps investors gauge the growth potential of the business. Bookings is unaffected by variations in invoicing terms. Regardless of whether a contract is invoiced annually or upfront, Bookings captures the total contracted amount early on. This eliminates the noise associated with invoicing terms and provides a clearer understanding of quarter performance.
Bookings and its short-term counterpart are relatively new metrics due to recent accounting standards (ASC 606). As a result, there is limited historical data available, which may limit the ability to analyze long-term trends accurately.
Bookings does not account for contracts with different durations. Contracts with the same invoicing terms and annualized contract values can have varying Bookings amounts if they span different periods. This lack of normalization for contract duration can lead to differences in reported values and may introduce optical volatility to the metric.

RPO
RPO is a valuable metric for assessing the future revenue potential of many SaaS companies but not as relevant or useful for consumption-based companies. Consumption-based companies differ from traditional subscription SaaS models in that their revenue is derived from usage or consumption of their services rather than fixed recurring payments. These companies often have flexible pricing structures based on usage volume, making it challenging to apply RPO in the same way as for subscription-based businesses. Since consumption models typically lack long-term contractual commitments, the backlog of future obligations, which RPO captures, is minimal. As a result, RPO fails to provide meaningful insights into the revenue-generating potential of consumption-based businesses.
RPO involves summing up the total value of the remaining obligations yet to be fulfilled under existing contracts. This includes all contracted revenue that has not been recognized and requires further performance or service delivery to satisfy the contractual terms. For example, if a SaaS company has contracts with a total value of $10M and has already recognized $4M in revenue, the RPO would be $6M.
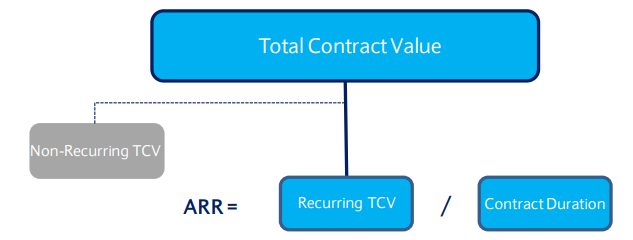
ARR
ARR was predominantly used as a metric by companies undergoing a cloud transition, helping to normalize revenue declines often seen in the early stages of such transitions. It was also employed as a vanity metric by private companies to showcase scale. Over time, more companies began disclosing ARR in various categories. For companies operating on on-premise term license models, ARR is used to normalize revenue recognition under ASC 606. This standard mandates upfront revenue recognition for the license component.
While ARR has gained popularity, it is essential to acknowledge its limitations:
Differing Definitions: Each company defines ARR differently, leading to a lack of standardization. This lack of consistency makes it challenging to compare ARR across companies. It is important to critically evaluate the definition of ARR and question companies that utilize misleading definitions. Comparisons with other metrics like TTM or annualized billings can be helpful in evaluating the accuracy of ARR.
Misleading Interpretations: If ARR significantly deviates from reported revenue figures, it may indicate potential issues with how the metric is calculated. For instance, the example of DOMO highlights a discrepancy between $100 million in disclosed ARR as a private company in early 2015 and reaching $100 million in TTM GAAP revenue in 2018. DOMO's definition of ARR as an annualized billings run rate differs significantly from GAAP revenue, showcasing the potential for misleading interpretations
Non-GAAP Metric: ARR is a non-GAAP metric, allowing companies to modify their methods of calculation or exercise judgment in what the metric encompasses. This flexibility raises concerns regarding the consistency and comparability of ARR across companies.
Limited Guidance: Despite its growing prominence, many companies do not provide explicit guidance on ARR. While some companies like PATH, AYX, and PEGA do guide to ARR, broader adoption of ARR guidance is desirable to enhance transparency and aid investors in evaluating performance.
NRR
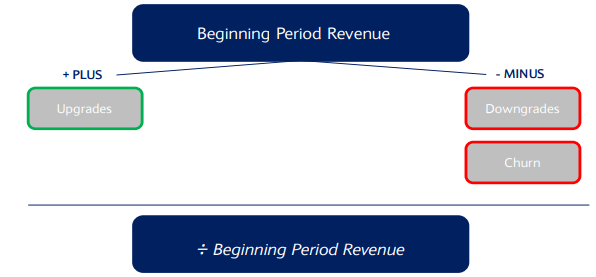
To assess the performance of consumption companies, Net Revenue Retention (NRR) emerges as a valuable metric. Changes in NRR often indicate forthcoming accelerations or slowdowns for consumption companies. NRR is particularly useful due to its volatility and ability to capture usage patterns. Unlike traditional customer retention metrics like churn, net dollar retention considers all potential actions that existing customers can take. It captures scenarios such as upgrading, renewing, downgrading, or churning. By weighing the aggregate customer actions, net dollar retention provides a more comprehensive view of customer behavior and its impact on revenue.
While net dollar retention offers insights into revenue brought in by customers, it lacks the ability to reveal customer dynamics. By replacing customer count with revenue, there is a trade-off. For example, a business may exhibit consistently growing net dollar retention over multiple periods, indicating strength. However, when considering churn rates, customer dynamics may raise concerns. Net dollar retention alone does not provide a comprehensive understanding of customer trends.
One significant drawback of net dollar retention, shared with retention rates in general, is the lack of consideration for new customer activity. This becomes problematic as new customers can contribute significantly to business growth. The absence of new customer input in the calculation may overlook a significant portion of a company's growth. Additionally, the way a business acquires new customers can impact its net retention rate, as different acquisition strategies may result in varying retention outcomes.
Other SaaS Business Metrics
· Gross Customer Retention (%) = (Beg. Customers - Customers Lost) / Beg. Customers
· Customer Churn (%) = 1 – Gross Customer Retention
· Net Customer Retention (%) = Total Ending Customers / Beg. Customers
· Net Dollar Retention (%) = (Beginning Revenue + Up-Sells – Down-Sells – Churn) / Beginning Revenue
· LTV to CAC = [(Net New Revenue * Gross Margin) / Churn] / (Prior S&M * % Direct S&M Assumption)
· CAC Payback Period = (Prior S&M * % Direct S&M Assumption) / (ARPC * Gross Margin)
Seat Based Model (CRM)
