
NVDA: Unit Economics

Ran NVDA through my AI workflow and not posting the full equity research note output (unless people want to see it) but wanted to share the unit economics output as I thought it was pretty dam good and anchored in reality. This is one of the skills that is part of the workflow and does a standalone output on unit economics.
Also created a skill that converts the .md file into a more copy and paste friendly word style that is pasted below. Thanks for the suggestion amul.
NVDA — Unit Economics and Economic Margin Analysis
Purpose: Reconstruct the true economic unit for NVIDIA’s AI infrastructure business. NVIDIA’s reported gross margin understates the real value of its position in the AI stack. This overlay deconstructs the per-token, per-watt, per-rack, and per-dollar economics to show where value is created, captured, and at risk.
1. Why Reported Gross Margin Is Insufficient
NVIDIA’s 71.1% FY2026 GAAP gross margin is useful but doesn’t capture:
1. The economic value of the CUDA moat**The economic value of the CUDA moat** — NVIDIA captures a premium not just on chips but on the full stack of software-enabled acceleration. This premium is not separable from the hardware ASP in the P&L.
2. Rack-level economics**Rack-level economics** — A single NVL72 rack-scale system has radically different economics than a discrete GPU sale; reported revenue/unit doesn’t reflect the transformation.
3. Token-production economics**Token-production economics** — For CSPs, NVIDIA hardware produces revenue through inference tokens. The economic relationship between hardware cost and revenue generation is the true lens for evaluating NVIDIA’s competitive position.
4. Architecture-transition true cost**Architecture-transition true cost** — Reported GM during Blackwell ramp understates normalized margins; adjusting for ramp costs shows the underlying margin trajectory more clearly.
2. The Economic Unit: Revenue Per GPU-Hour Delivered
The relevant unit for evaluating NVIDIA’s business model is what its hardware enables the customer to produce — and therefore the maximum price the customer will pay.
Token Production Economics — Dual Workload Framework
A single-throughput, single-price estimate obscures the actual economics. In practice, NVL72 racks serve two economically distinct workload categories with materially different ASP and throughput profiles:
Workload A: Frontier / Enterprise Inference (GPT-4 class, reasoning models, enterprise APIs)**Workload A: Frontier / Enterprise Inference (GPT-4 class, reasoning models, enterprise APIs)**
· Throughput: ~0.5–2M tok/sec sustained (high per-token latency budget; speculative decoding; KV-cache memory overhead dominates)
· Pricing: $2.00–5.00/M tokens (enterprise contracts, SLA-backed, reasoning model premium)
· Illustrative: 1.5M tok/sec × $3.00/M × 0.85 utilization × 31.5M sec/year = ~$127M/rack/year**~$127M/rack/year**
Workload B: Commodity Inference (Llama-3 70B class, open-weight, price-sensitive)**Workload B: Commodity Inference (Llama-3 70B class, open-weight, price-sensitive)**
· Throughput: ~1.5–2.5M tok/sec sustained (production reality: KV-cache memory overhead, batching constraints; Jensen’s cited 40× is peak FP8 over Hopper at maximum batch size, not sustained CSP production rate)
· Pricing: $0.60–0.90/M tokens (current Llama-3 70B market rate; structural downward pressure as competition intensifies)
· Illustrative: 2.0M tok/sec × $0.75/M × 0.85 utilization × 31.5M sec/year = ~$40M/rack/year**~$40M/rack/year**
NVL72 Rack Economics by Workload Mix (rack ASP = $3.0M):**NVL72 Rack Economics by Workload Mix (rack ASP = $3.0M):**
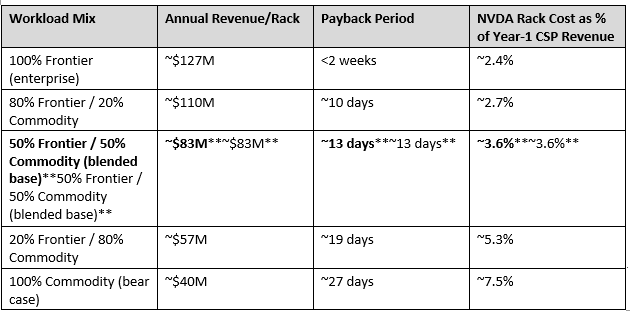
The economic implication holds across the full range.**The economic implication holds across the full range.** Even in the pure-commodity bear case ($40M/rack/year at Llama-3 70B rates), the NVL72 pays back in under 30 days of production. The hardware cost is at most ~7–8% of year-1 CSP revenue — versus 80–90% for a conventional capex asset. This is why the AI factory framing is economically accurate regardless of which end of the pricing spectrum materializes.
Payback sensitivity — the key question:**Payback sensitivity — the key question:** At what token price does the annual CSP revenue fall below $3M/rack (i.e., payback > 1 year)?
· At 2M tok/sec × 0.85 utilization: break-even token price = $3M / (2.0M × 0.85 × 31.5M) ≈ $0.056/M tokens**$0.056/M tokens** — 10–15× below current Llama-3 70B market rates.
· Even under extreme commoditization (Llama-3 70B at $0.10/M tokens, down ~85% from today), payback remains ~6 months.
The AI factory thesis is not fragile to token price deflation unless prices fall by an order of magnitude from today — which would require near-zero marginal-cost inference at scale from a competing hardware stack.
What This Means for Pricing Power
The blended NVL72 economics show the CSP captures $40–130M in annual revenue from a $3M rack. As long as inference token prices remain above ~$0.05–0.10/M (well below any current market rate), there is structural room for NVIDIA to raise rack prices without making the economics unattractive.
The limit on pricing power:**The limit on pricing power:** AMD MI300X and MI325X racks offer competitive token throughput at lower ASP. NVIDIA’s effective pricing floor is AMD’s total cost of ownership — hardware + CUDA migration + ROCm integration + performance gap on real production workloads. As long as that gap exists (industry benchmarks show 10–30% NVDA advantage in real-world tokens/sec/watt on production inference), NVIDIA maintains pricing power above AMD’s effective ASP.
The mix-shift risk:**The mix-shift risk:** If commodity inference (Llama-class) expands to 80%+ of total NVL72 utilization at sub-$0.50/M pricing, per-rack economics compress from ~$83M toward ~$30–40M/year. This would not threaten the payback thesis but would reduce the CSP’s incentive to buy the most expensive NVDA rack vs. a cheaper AMD alternative. The bear case is a mix-shift story, not a payback-period story.
3. Per-Watt Economics — Performance/Watt as the True Competitive Metric
Data center operators face a binding constraint: total power budget. A facility with a 100MW power capacity generates a fixed maximum revenue regardless of what hardware fills it. The economic question is: which hardware generates the most revenue per watt?**which hardware generates the most revenue per watt?**
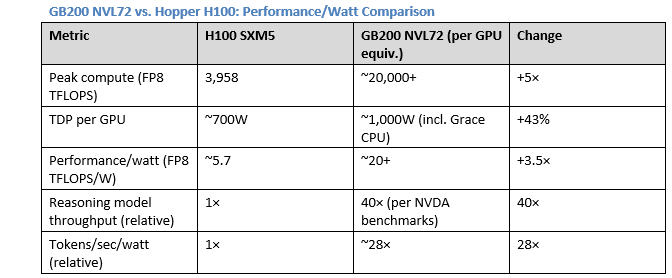
Economic implication:**Economic implication:**NVIDIA directly monetizes power efficiency for its customers A data center with a fixed 100MW power budget generates ~28× more inference revenue with GB200 NVL72 vs. H100 per watt consumed. Since data center revenue is bounded by power, **NVIDIA directly monetizes power efficiency for its customers**. The CSP’s motivation to upgrade is not just performance — it is access to more production capacity within an existing power-constrained facility.
GB300 step-up (Blackwell Ultra, FY2027):**GB300 step-up (Blackwell Ultra, FY2027):** Management has stated Blackwell Ultra delivers “another substantial step” in performance/watt. If the improvement is even 1.5× (vs. the 3.5–4× step from Hopper to Blackwell), the incremental economics remain compelling for CSP upgrades in FY2027.
Why Performance/Watt Is the Moat, Not Just Performance
AMD MI300X competes on absolute performance but has not achieved NVIDIA’s software stack efficiency. NVIDIA’s cuDNN, FlashAttention, TensorRT, and NIM microservices optimize inference throughput beyond raw silicon performance. Industry benchmarks consistently show NVDA achieving 10–30% better real-world tokens/sec/watt vs. AMD MI300X on production inference workloads, despite AMD’s improved silicon.
The software premium is captured in the hardware price:**The software premium is captured in the hardware price:** NVIDIA bundles the software stack with the hardware. The buyer pays for chips; they receive software. This makes the economic unit (revenue per token enabled) higher than what the raw hardware would achieve on a competitor’s software stack. It also makes direct price comparisons between NVDA and AMD misleading — the effective ASP of NVDA hardware includes embedded software value.
4. Rack-Scale Revenue Economics: The ASP Expansion Story
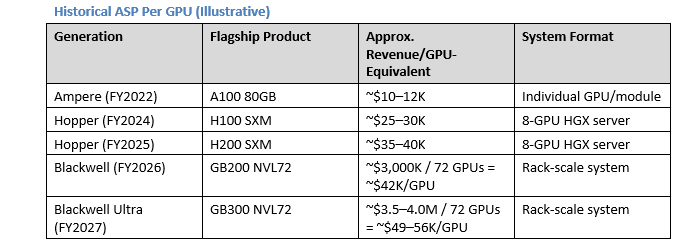
The rack-scale transition is the most important unit economics shift in NVIDIA’s history.**The rack-scale transition is the most important unit economics shift in NVIDIA’s history.** By moving from component to system sales:
· Revenue per order grows from ~$200K (8-GPU server) to ~$3M (NVL72 rack) — 15× per order
· The buyer goes from a purchasing department to a C-suite capital budgeting decision
· Competitive displacement becomes harder (replacing a rack-scale system is a multi-year migration vs. swapping a GPU card)
· NVIDIA captures more of the system value chain (NVLink switches, Grace CPUs, networking)
NVLink Fusion: Extending the Economic Capture Model
NVLink Fusion enables third-party chips (custom ASICs) to connect to NVIDIA’s NVLink fabric. The economic model is:
· Customer designs custom ASIC (e.g., Google TPU v6)
· Customer wants NVLink-scale interconnect bandwidth (vs. inferior PCIe)
· Customer pays NVIDIA NVLink licensing/connectivity fee
Unit economics implication:**Unit economics implication:** Even when a customer uses custom silicon, NVIDIA can capture some revenue from the NVLink integration. If NVLink Fusion matures, NVIDIA becomes a “switch and fabric” business in addition to a GPU business — a royalty stream on competitor hardware. This is a fundamentally different unit economics profile: near-zero marginal cost, software-like margins.
Current revenue: minimal (<$1B in FY2026). Long-term potential: $5–10B/year if adopted at 3–4 major hyperscalers.
5. True Economic Margin Reconstruction
Reported GAAP gross margin (71.1% FY2026) understates NVDA’s economic margin for two reasons:
1. Architecture-transition compression is temporary**Architecture-transition compression is temporary**, not structural
2. SBC is included in COGS and OpEx**SBC is included in COGS and OpEx**, making both gross and operating margins appear lower than normalized economics.
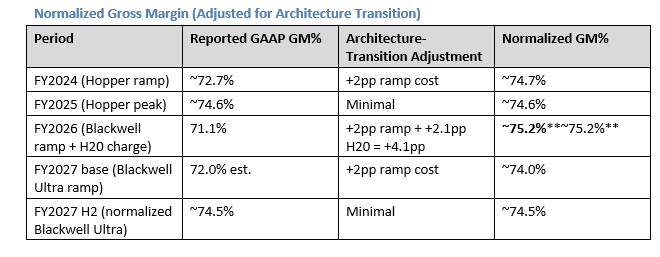
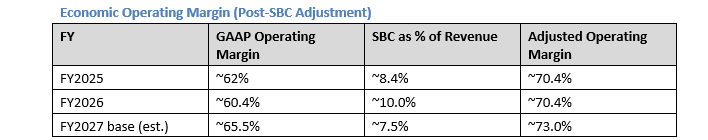
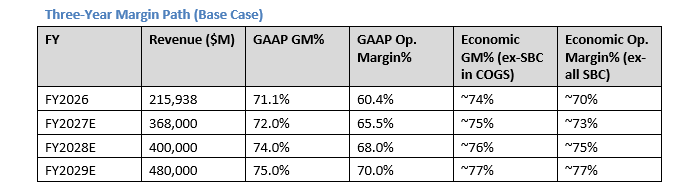
The true economic operating margin — excluding non-cash SBC — is approximately 70–73%**70–73%**. This is the highest operating margin in the semiconductor industry and rivals best-in-class software businesses. The compression in FY2026 GAAP operating margins (60.4%) vs. the economic reality (70.4%) is entirely explained by SBC.
6. Contribution Economics by Revenue Category
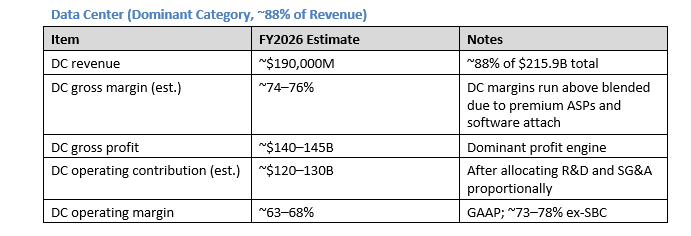
The data center contribution funds everything else.**The data center contribution funds everything else.** Gaming, ProViz, Auto, and OEM combined represent ~12% of revenue but require roughly the same opex investment as the segment revenue suggests — they are not loss-making but they generate minimal operating leverage relative to DC.
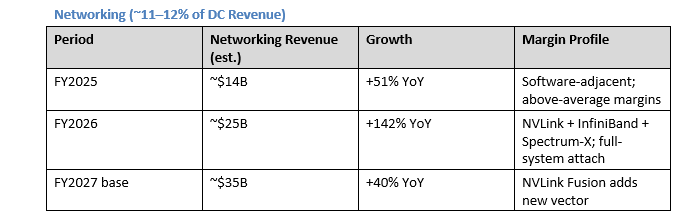
Networking carries structural economic advantages:**Networking carries structural economic advantages:** NVLink and Spectrum-X are deeply integrated with NVIDIA’s GPU ecosystem and cannot be replaced without rearchitecting the entire cluster. Gross margins for networking (switches, cables, NICs) are lower than compute (50–60%), but the attach rate creates revenue lock-in that supports the overall compute purchase.
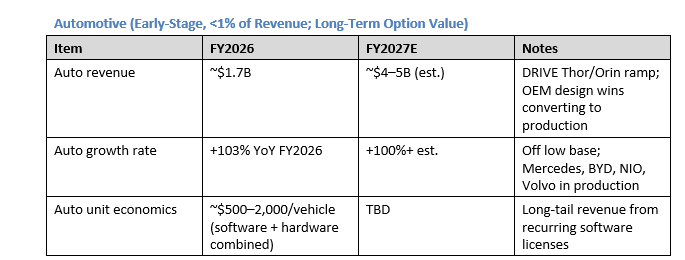
Auto is not currently material to NVDA’s valuation but represents option value. A 10M-vehicle/year deployment at $1,000 average NVDA content = $10B/year — meaningful but still small relative to DC.
7. Margin-Path Analysis: FY2027 to FY2029
Key Margin Drivers by Period
FY2027 H1 (Q1–Q2):**FY2027 H1 (Q1–Q2):** Blackwell Ultra (GB300) entering mass production
· Ramp costs suppress GM to 71–74% range
· R&D spending on Vera Rubin ramp accelerates
· NVLink Fusion begins contributing; DGX Cloud software licenses growing
· Net: GAAP GM ~70–73%; economic margin ~72–74% (ex-SBC)
FY2027 H2 (Q3–Q4):**FY2027 H2 (Q3–Q4):** GB300 yields mature; Vera Rubin sampling
· Management targets mid-70s non-GAAP GM by “late calendar 2026”
· Incremental NVL72 ASP premium from GB300 vs. GB200 architecture benefits GM
· Operating leverage from fixed R&D base against growing revenue ($78–85B/quarter)
· Net: GAAP GM ~74–75%; economic margin ~76–77% (ex-SBC)
FY2028 (Vera Rubin year):**FY2028 (Vera Rubin year):**
· Vera Rubin ramp creates another 2–3pp GM compression in H1 FY2028
· Counter-balance: Rubin’s NVL144 form factor (2× GB300 per rack) doubles revenue per rack footprint
· NVLink Fusion reaching $3–5B annual revenue — near-zero marginal cost
· Economic margin potential: 78–80% (ex-SBC) in H2 FY2028 as Rubin yields mature
The compounding margin dynamic:**The compounding margin dynamic:** Each architecture generation both compresses (during ramp) and then expands (at maturity) margins. The net secular trend is stable to slightly expanding economic margins because:
1. ASPs grow faster than COGS (rack-scale shift)
2. Software attach rate increases (NIM, AI Enterprise, NVLink Fusion)
3. Fixed operating leverage: R&D growing at 20–25%/year vs. revenue at 30–50%/year
The long-run thesis on margins:**The long-run thesis on margins:** As Rubin matures and NVLink Fusion scales, NVIDIA transitions toward a platform model where a growing share of revenue carries software-like economics. A 5-year margin trajectory toward 75–80% GAAP gross margin (ex-ramp periods) and 75%+ economic operating margins is consistent with the architectural and product strategy.
8. Unit Economics Summary: The Bull/Bear Divide
Bull Unit Economics Case
· Token demand grows at 5× annually (inference scaling law)
· Performance/watt advantage widens each generation (Rubin delivers another 3–5×)
· Rack-level ASP compounds 20–30% annually as NVL144 replaces NVL72
· NVLink Fusion creates a royalty-like revenue stream on third-party compute
· Economic margin reaches 77–80% by FY2029 as software attach scales
Implied FCF:**Implied FCF:** At $560B FY2029 revenue, 77–80% economic operating margins, ~25% tax: $560B × 78% × 75% = ~$328B FCF potential (pre-SBC; adjusting for SBC ~$30B → ~$298B adjusted FCF). At 20× adjusted FCF: $5.96T equity value.
Bear Unit Economics Case
· Token price deflation offsets volume growth (commodity inference market by FY2028)
· AMD + custom ASICs erode 25% of NVDA’s compute TAM
· Rack-level ASP growth decelerates as competition intensifies
· GM stays structurally at 69–72% due to HBM cost inflation and supply chain commitments
· Architecture delay (Rubin slips) creates a revenue gap in FY2028
Implied FCF:**Implied FCF:** At $330B FY2029 revenue, 70% GAAP margin, 55% op margin: $330B × 55% × 75% = ~$136B GAAP FCF; adjusted FCF ~$110B. At 15× adjusted FCF: $1.65T equity value → ~$68/share.
I'm curious how you built the skill / did you only train Cowork on public filings and sellside reports, or also feed it other data / your own insight?
Excellent analysis. Top notch . Clearly you make a bull case for Nvidia. The insight on the payback times for hyperscalers was especially thoughtful.
On NVDA, the power efficiency argument suggests that NVDA’s product release cadence is spot on